Why Most B2B Companies Miss 60% of Their Market — And How to Fix It
Traditional ICP filters leave the majority of qualified buyers invisible to your sales team. Here's what high-performing outbound teams look for instead.
 Konnektys TeamMay 19, 2026 · 8 min read
B2B sales teams are generating more data than ever. They have access to better databases, more sophisticated enrichment tools, faster sequencing software, and more channels for outreach than at any point in the history of the profession.
And yet pipeline is getting harder, not easier. Reply rates are falling. Customer acquisition costs are rising. SDRs are spending more time prospecting and generating fewer qualified opportunities from it.
The problem is almost never messaging. It is almost never sequencing cadence. It is almost never the channel.
It is account selection.
When we audit outbound systems, a consistent pattern emerges: a significant share of CRM records — often approaching 40% — do not match the company’s real Ideal Customer Profile. Every email, every call, every dollar spent on those records is structural waste. And the accounts that would qualify are often invisible because the filters being used to find them are the same blunt instruments every competitor is using.
Why Traditional ICP Targeting Is Failing
The standard ICP targeting workflow has not meaningfully changed in a decade: define the target by industry, headcount, and geography; export from a database; enrich with email and phone; sequence and send.
This workflow has two fundamental problems that compound each other.
Problem 1: Firmographic filters describe what a company looks like, not what it’s doing.
A 200-person SaaS company with a 3-person sales team is structurally different from a 200-person SaaS company with a 40-person sales organisation — but they are identical in a firmographic filter. Firmographic data describes the outer shell of a company at a moment in time. It says nothing about what is happening inside that company right now: whether they are hiring, expanding, adopting new tools, under new leadership, or sitting in a stable state with no reason to evaluate anything new.
Problem 2: Every competitor is using the same filters on the same data.
Apollo, ZoomInfo, Crunchbase, LinkedIn Sales Navigator — every SDR team in your market has access to the same databases. The companies at the top of every standard filter are also receiving the most outbound volume from the most competitors simultaneously. Generic targeting produces generic results, and the most “obvious” accounts in any market are the most contested, the most fatigued by outreach, and the least likely to engage.
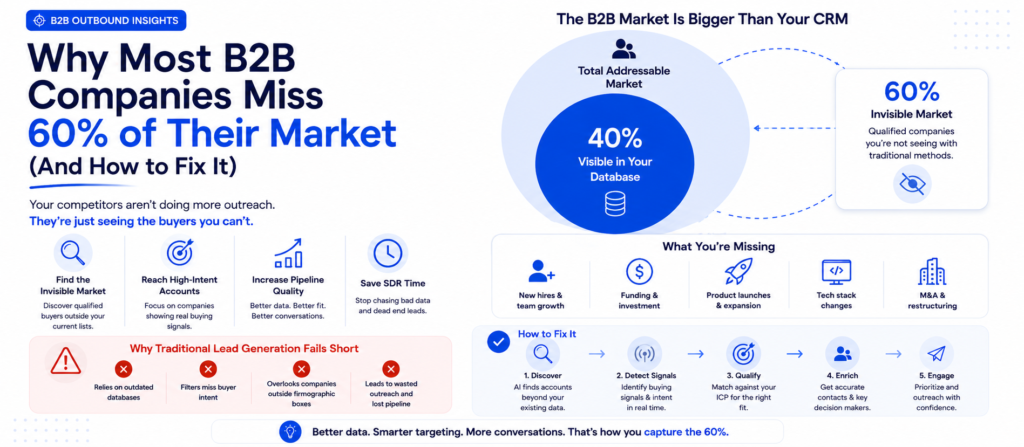
The accounts that would engage — because something relevant is happening to them right now — are in the 60% that firmographic filters cannot see.
The Math Behind the 60% Gap
The 60% figure is an estimate grounded in four compounding factors, each of which removes a portion of the qualified market from visibility.
Firmographic look-alikes not in a buying state
Two companies can match on every firmographic dimension and be at completely different stages of buying readiness. At any given time, approximately 70–80% of your firmographic ICP matches are in a non-evaluating state. Traditional filters have no way to separate these companies from the ones in active motion.
Data decay removing accurate records — annually
B2B contact and company data decays at 25–30% per year. People change roles, companies get acquired, email addresses get recycled. A database record accurate twelve months ago has a meaningful probability of being wrong today — producing hard bounces and spam complaints that damage sending infrastructure for future campaigns.
Non-obvious ICP matches missed by standard filters
The most interesting buyers often don’t match obvious filter criteria. A company technically below your headcount threshold but about to scale past it after a Series A. A company in an adjacent industry with the same operational problem. A company growing faster than the data update cycle. All qualified. All invisible.
Timing invisibility — qualified accounts in non-buying states
Even perfect ICP matches with accurate records are often in states where outreach cannot convert — locked into a competitor contract, mid-implementation, in a budget freeze, or at the wrong point in their decision cycle. Without behavioural signal data that tells you when a company is entering an evaluation state, outreach timing is random.
The compounding effect: the average firmographic-only outbound programme is reaching, at any given time, roughly 30–40% of the accounts in its target market that would actually respond positively to outreach. The other 60–70% are invisible — not because they don’t exist or don’t qualify, but because the targeting method cannot identify them.
What the Invisible Market Actually Looks Like
The invisible market is not composed of bad-fit accounts that should be excluded. It is composed of three distinct account types that firmographic filters structurally cannot surface:
Type 1
Pre-threshold accounts approaching your ICP criteria
Companies below your headcount minimum but growing rapidly. Companies whose last funding round just moved them into your revenue range. They’ll be obvious ICP matches in 90–120 days — but competitors who found them earlier will have established relationships first.
Type 2
In-motion accounts inside your existing ICP range
Companies that match all firmographic criteria but are specifically in motion — a new VP of Sales three weeks in, a recent funding announcement, aggressive SDR hiring. These are in your database already. The filter finds them. Nothing in the standard workflow tells you they’re different from the 80% of similar companies that aren’t moving.
Type 3
High-fit accounts in non-obvious segments
Companies that solve the same problem your product addresses through a different route — showing up in a different industry classification. Companies that have grown past your maximum headcount but still have the buying unit you sell to embedded within a larger organisation. Companies not indexed in major databases.
All three types require different methods to find. None of them appear in a standard firmographic database export.
How ICP Drift Happens — And Why Nobody Notices
ICP drift is the gradual divergence between the customer profile a company targets and the customer profile that actually converts, renews, and expands. It is remarkably common and rarely caught until pipeline quality has already suffered for quarters.
Mechanism 1: The ICP was defined by aspiration, not evidence
Many ICPs are built at company founding based on who the founders want to sell to rather than who has already bought. When actual customers don’t match the aspirational profile, the mismatch is attributed to GTM execution rather than ICP accuracy. The outbound targeting continues against a profile that was never correct.
Mechanism 2: Early customers don’t represent the repeatable segment
The first ten customers often come through warm network connections and founder relationships. They may not represent the segment that will respond to cold outreach at scale. Building an ICP from early customers without accounting for how they were acquired produces a profile that cold outbound cannot replicate.
Mechanism 3: The market moves and the ICP doesn’t
A company that was the ideal buyer twelve months ago may no longer be — because they’ve adopted a competing solution, their stage has moved past the problem your product solves, or the specific pain you address has been commoditised. ICPs defined once and never revisited against actual pipeline outcomes drift continuously without anyone noticing.
Mechanism 4: SDRs manually filter without updating the official profile
Experienced SDRs quickly learn which accounts from the official ICP convert and which don’t. They start manually filtering lists — removing certain company types, deprioritising certain titles. This informal adjustment is valuable signal that the ICP has drifted — but because it’s happening informally, it never gets incorporated into the targeting logic.
Diagnostic signals that ICP drift has occurred: reply rates that stay flat regardless of copy changes; best customers who don’t match the profile you’re targeting; SDRs who manually filter prospect lists before working them; deals that close but don’t renew at the expected rate.
How to Audit Your ICP Right Now
Before building a signal stack or expanding targeting logic, the existing ICP needs to be audited against actual outcomes. Here is the process:
Pull your last 20 closed-won deals
For each one, record: industry, headcount, geography, the specific job title that signed, the trigger that started the conversation, and the time from first contact to close.
Identify the pattern that isn’t in your official ICP
Compare the closed-won data against your official ICP definition. What attributes do your best customers share that your ICP doesn’t specify? What filter criteria are you officially targeting that don’t appear in your actual wins?
Audit your CRM for ICP compliance
Pull a random sample of 100 active pipeline records and score them against your revised ICP criteria. In most audits, 35–50% of active pipeline records fail at least one critical ICP criterion — meaning between one-third and one-half of ongoing SDR effort is being spent on accounts that aren’t real buyers.
Ask your SDRs what they’re actually filtering for
The informal filtering experienced SDRs apply is a proxy for the real ICP. What types of companies do they skip? What attributes make them prioritise an account? This informal knowledge often encodes more accurate ICP information than the official document.
Define the TAM against the revised ICP
Once the ICP is grounded in actual outcomes, establish the total addressable market against those criteria. Market research and TAM analysis does this properly — counting the real universe before building targeting logic within it. Without a defined TAM, there is no baseline against which to measure market coverage.
The Four Signal Categories That Surface the Hidden 60%
Behavioural and operational signals identify the accounts that firmographic filters cannot — because signals describe what is happening inside a company right now, not what it looks like on a database record.
1. Hiring Signals
Hiring patterns are one of the richest and most publicly available signal sources in B2B prospecting. When a company posts for an SDR, a RevOps engineer, a VP of Sales, or a Head of Revenue Operations, they are announcing — in near-real time — the operational gap they are trying to fill.
The granularity matters. A company posting for three mid-market AEs is signalling differently from one posting for a VP of Sales and an SDR team lead simultaneously. The first is scaling a known model; the second is rebuilding the sales function from the top — which creates a specific, time-sensitive buying window.
Hiring intent data monitors these patterns systematically across your ICP universe — not just whether a company is hiring, but what that specific pattern reveals about their operational state and near-term priorities. This converts a manual job-board monitoring task into a continuous signal feed.
2. Technology Signals
A company’s technology stack tells you what problems they have already decided to solve — and what adjacent gaps that creates. A company adopting Salesforce for the first time is shifting to structured sales operations; the period around that implementation is a specific buying window for SDR tools, data services, and RevOps infrastructure.
Technographic data append maps the full technology environment at the account level — not just what tools are currently deployed, but what has been recently adopted, what has been dropped, and what the resulting configuration implies about remaining gaps. When stacked with firmographic ICP criteria, technographic filtering narrows a broad ICP list to the specific accounts where the tech stack context is directly relevant to your offer.
3. Events and Trigger Signals
Funding rounds, leadership changes, product launches, acquisitions, office openings, conference sponsorships — these are public events that mark transitions. Companies at transitions are actively evaluating. Companies in stable states are not.
Funding round
30–90 day evaluation window before budget decisions lock in
New VP of Sales
90-day window before inherited vendor relationships become entrenched
Acquisition
Infrastructure overlap requiring new purchasing decisions
Events and buyer intent data tracks these trigger moments across your target account universe in real time — so outreach lands inside the window, not after it has closed.
4. Website and Operational Signals
Website structure reveals go-to-market motion. A company adding a “Book Demo” CTA and a pricing page is transitioning from founder-led to sales-led growth — creating a specific, time-sensitive buying opportunity for outbound infrastructure. Multi-country team structures, partner ecosystem pages, and large visible sales departments indicate companies that have resources and a mandate to invest in revenue infrastructure.
Web and LinkedIn data scraping aggregates these signals systematically across your ICP universe — converting what would be manual account research per company into a structured signal feed that updates continuously.
The TAM Foundation: You Need Boundaries Before Signals
Signal-based targeting only produces useful output when it is running within a defined account universe. Without a clear TAM boundary, signals have no frame of reference.
| Term | Full name | Definition |
|---|---|---|
| Total Addressable Market | TAM | Total number of companies that meet your ICP criteria — everyone who could theoretically buy your product. |
| Serviceable Addressable Market | SAM | Subset of TAM you can practically reach — constrained by geography, language, sales team capacity, and compliance factors. |
| Serviceable Obtainable Market | SOM | Portion of SAM you can realistically win in a given period, accounting for competition, conversion rates, and sales cycle length. |
Most outbound teams operate without a defined TAM. They know their ICP in qualitative terms but have never counted how many companies actually meet those criteria. Without that count, there is no way to know what percentage of the market you’ve already contacted, whether you’re running out of fresh accounts, or how to segment the market into priority tiers.
Market research and TAM analysis establishes these boundaries properly — counting the real universe by segment, mapping it by geography and ICP criteria, and identifying the realistic pool of accounts to prioritise signal monitoring within. This is the foundation that makes signal-based targeting produce actionable output rather than an unmanageable list.
Account Discovery vs Database Enrichment — A Critical Distinction
Most sales intelligence platforms focus on enrichment: improving the data quality of records you already have. Enrichment is valuable. But it does not solve the harder problem: finding companies outside your current CRM that match your ICP and are showing buying signals right now.
Database Enrichment
“What do I know about accounts I already have?”
Adds email addresses, phone numbers, firmographic and technographic data to contacts and companies already in your CRM or list. Makes existing records more complete and usable.
Account Discovery
“What accounts exist that I don’t know about yet?”
Identifies companies outside your current CRM that match your ICP and are showing buying signals right now. Analyses websites, job postings, public announcements, LinkedIn activity, and technology adoption signals.
The 60% gap is almost entirely a discovery problem, not an enrichment problem. The accounts in the invisible market are not in your CRM. No amount of enrichment on existing records makes them visible.
AI-powered lead research operates at the discovery layer — finding accounts that meet your ICP criteria from signal evidence rather than database lookups. Contact list building then constructs the verified, signal-enriched contact layer on top of those discovered accounts.
How to Build a Signal Stack for Your Market
A signal stack is the combination of signal sources you monitor continuously within your defined ICP universe. The goal is a system that surfaces in-motion accounts automatically — not manually, one at a time, but as a continuous feed that prioritises itself.
Define the universe
TAM established against precise ICP criteria. Every downstream signal runs within this boundary.
Hiring signal monitoring
Job posting tracking for roles that indicate operational investment in the areas your offer addresses. Updated in near-real time from job boards, LinkedIn, and company career pages. Hiring intent data maintains this layer continuously.
Technology signal monitoring
Tech stack mapping across the ICP universe. Accounts where recent tech adoption creates a specific gap relevant to your offer surfaced automatically. Technographic data append maintains this layer.
Event and trigger monitoring
Funding rounds, leadership changes, product launches, acquisitions tracked across the ICP universe. Events and buyer intent data maintains this layer with real-time trigger alerts.
Web and LinkedIn signal monitoring
Website changes, LinkedIn hiring announcements, leadership posts, company updates. Web and LinkedIn data scraping aggregates this across the account universe without manual research per company.
Account scoring
Each account scored by ICP fit and current signal strength. Output: a prioritised queue — hot accounts with multiple active signals at the top, warm accounts in a nurture track, stable accounts on a watch list. AI-powered lead research runs this scoring continuously.
Contact verification
Verified, current contact data for top-tier accounts. Email finding and verification, reverse email and phone appending, and phone number finding complete this layer.
What Fixing It Looks Like Step by Step
The gap between “we’re missing 60% of our market” and “we’re reaching the right accounts at the right time” closes through a specific sequence. Not all at once — sequentially, in the right order.
Audit the existing ICP against actual closed-won data
Don’t start with the official ICP document. Start with the customers who bought, stayed, and expanded. Run the audit: pull closed-won deals, identify the pattern, score existing CRM records against the corrected criteria, fix the targeting before adding more volume.
Define the TAM against the corrected ICP
Count the real universe. Segment it by geography, industry, and size band. Understand how many companies you’re actually targeting before adding signal infrastructure on top.
Clean the CRM before adding to it
Records that don’t match the real ICP are worse than empty — they create work without pipeline. CRM cleaning removes the noise. CRM data enrichment updates the records worth keeping with current, accurate data.
Build the signal stack
Implement signal monitoring across the TAM universe — hiring, technology, events, web signals — and connect it to an account scoring system that produces a prioritised queue. This is where the invisible 60% becomes visible.
Execute outreach on the prioritised queue with signal-specific personalisation
The first-line of every outreach should reference the specific signal that elevated the account — the new VP of Sales, the SDR hiring surge, the funding announcement, the tech stack change. See our guide on why cold email gets replies for how signal-based personalisation converts at a structurally different rate.
Feed conversion data back into the ICP and signal criteria
Which signals produced the most replies? Which account types converted most efficiently? This data sharpens the ICP and refines signal weighting over time. As we cover in our AI prospecting guide, this feedback loop is the single highest-leverage change most outbound teams can make.
The result is not incremental improvement on an existing outbound system. It is a structurally different system that identifies the right accounts at the right moment — and converts outbound from a volume game into a timing game.
FAQ: B2B ICP Targeting and Market Coverage Answered
What is B2B ICP targeting?
+
Why do most B2B companies miss 60% of their qualified market?
+
What is ICP drift and how do I know if my ICP has drifted?
+
What is the difference between account discovery and database enrichment?
+
What buying signals are most predictive for B2B sales?
+
How often should B2B lead databases be refreshed?
+
What is a TAM analysis and why does B2B outbound need one?
+
How do I fix a polluted CRM before launching a new outbound campaign?
+
Can signal-based targeting work for small outbound teams?
+
How does signal-based B2B targeting connect to cold email performance?
+
The Fix Is a System, Not a Campaign
The 60% gap is not a messaging problem. It is not a channel problem. It is a structural problem in how accounts are selected — and it cannot be closed by running more campaigns against the same targeting logic that created it.
Closing the gap requires: an ICP audited against actual outcomes; a TAM defined against that corrected ICP; signal monitoring built across the full account universe; a prioritisation system that surfaces in-motion accounts before the evaluation window closes; and outreach personalised to the specific signal that elevated each account.
That is a different system from what most B2B teams are running. And it is the infrastructure that makes the rest of the outbound investment — the SDRs, the sequences, the tools, the copy — actually work.
Find Out What Your Hidden Market Looks Like
Konnektys builds this system: ICP definition and TAM analysis, AI-powered account discovery and signal research, verified contact list building, CRM cleaning and enrichment, and fully managed outbound execution built on the signal stack.
Find out what your hidden market looks like →Missing 60% of your market? We’ll build the signal stack and ICP infrastructure that makes them visible.
Talk to Konnektys →Share this article:
Related articles
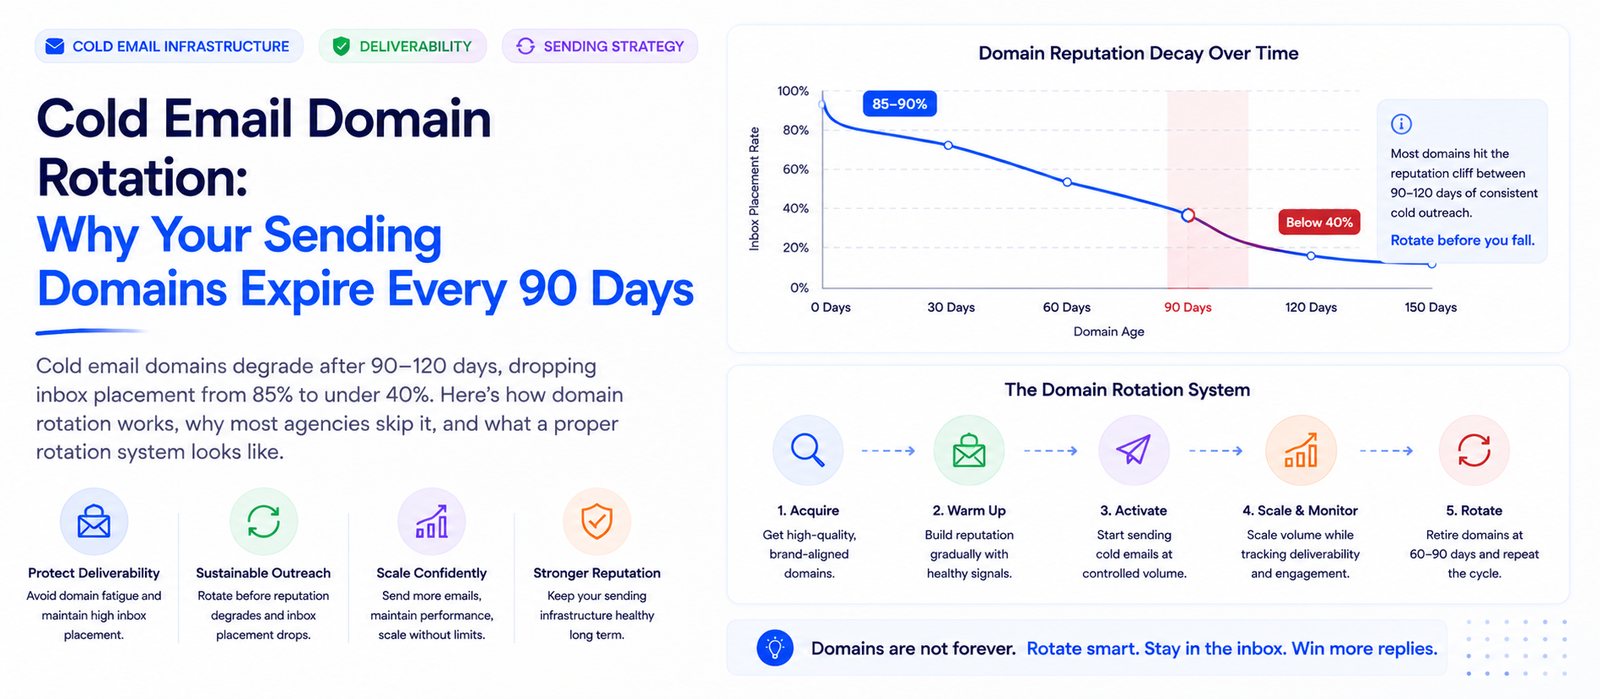
Your Cold Email Domain Has a 90-Day Shelf Life
Konnektys Team · 23 May, 2026